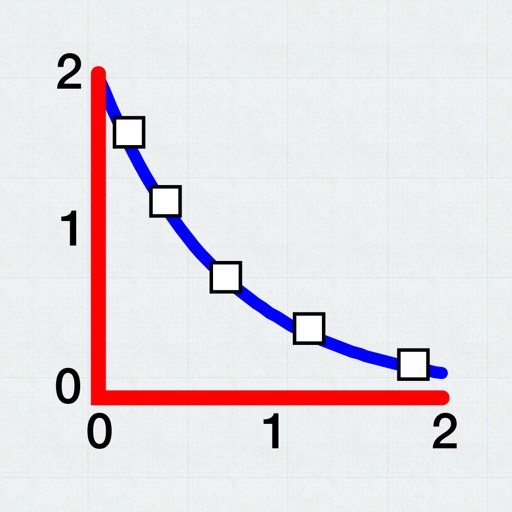
Allows users to plot and fit x, y data pairs. It supports curve fitting, value prediction, and kinetic data analysis. Data can be entered manually or imported from text or CSV files. Users can perform statistical analysis and generate graphs.
by Evan Kantrowitz★ 4.1106 ratingsProductivityFreeData updated 2026-09-08
Explore linear algebra concepts through animated visualizations of transformations. Manipulate matrices to apply rotations, expansions, and combinations. Edit matrix elements directly.
Measure pipe fittings and nuts by placing them on the screen and adjusting shape and diameter. Identify BSP and metric sizes with calibrated screen measurement. Access a library of standard sizes for quick reference.