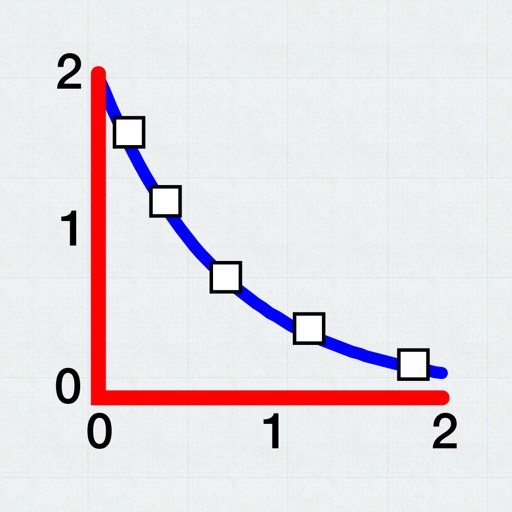
Allows users to plot and fit x, y data pairs. It supports curve fitting, value prediction, and kinetic data analysis. Data can be entered manually or imported from text or CSV files. Users can perform statistical analysis and generate graphs.
by Evan Kantrowitz★ 4.1106 ratingsProductivityFreeData updated 2026-09-08
Calculate pipe offsets for 90-degree and mitered fittings. Input dimensions manually or select from ANSI or DN standards. Compute offsets with elbows, tees, and various radii. Support any degree of offset calculation.
The app offers automated data collection and labeling solutions for manufacturers using QAD Enterprise Applications. It provides fault-proof, real-time data collection for the QAD community.
Display a fully customizable with IP and SI units. Plot HVAC processes using touch input. Save and email graphs. View detailed results and export data.
The app draws geometrical patterns similar to the SpiroGraph toy. It allows users to design complex artwork and draw mathematical curves like cycloids and trochoids.
Provides regression analysis for price trends, relative strength indicators for crypto performance comparisons, and real-time market data for live prices and volume.