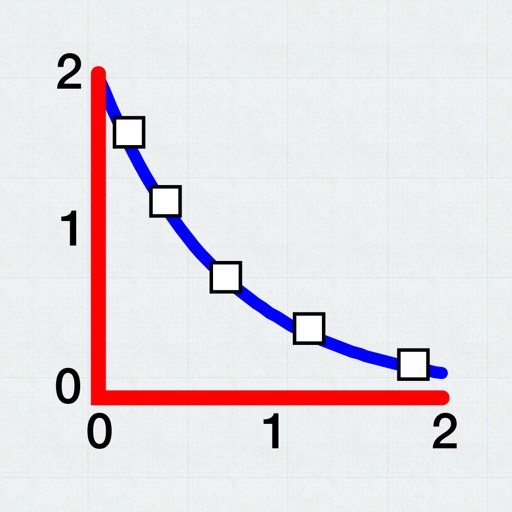
Allows users to plot and fit x, y data pairs. It supports curve fitting, value prediction, and kinetic data analysis. Data can be entered manually or imported from text or CSV files. Users can perform statistical analysis and generate graphs.
by Evan Kantrowitz★ 4.1106 ratingsProductivityFreeData updated 2026-09-08
The app calculates nonlinear wavelength conversion phasematching conditions using Sellmeier equations. It provides orientations, nonlinear optical coefficients, and tolerances for various crystals based on user-inputted wavelengths and temperature.
View p-h and p-T diagrams for and steam . Calculate thermodynamic values up to 1000 Mpa. Display phase transitions and property data based on IAPWS R7-97(2012) standards. Adjust pressure and temperature to observe state changes.