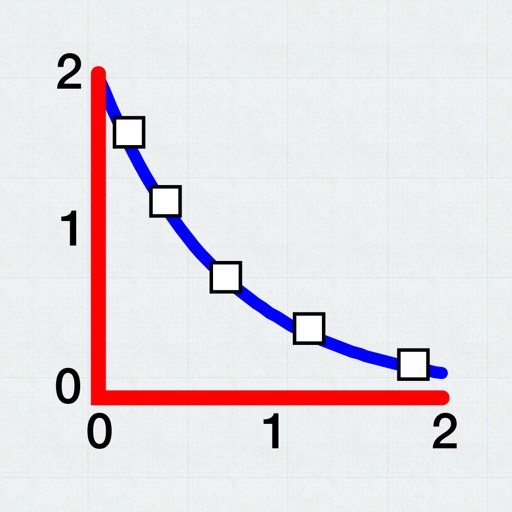
Allows users to plot and fit x, y data pairs. It supports curve fitting, value prediction, and kinetic data analysis. Data can be entered manually or imported from text or CSV files. Users can perform statistical analysis and generate graphs.
by Evan Kantrowitz★ 4.1106 ratingsProductivityFreeData updated 2026-09-08
Capture problems via photo, solve them with AI and detailed steps, and generate practice questions for reinforcement. View solutions and explanations for various topics.
Access chemical and nuclear data for and isotopes. View properties like density, melting point, and thermal conductivity. Explore nuclear details including half-life, decay mode, and daughter products.
Track and manage forestry data with parcel ownership layers and tax records. View cruising plot allocations and collect data offline. Register new accounts and access secured data. Sync with the website using the same account.
Create and visualize graphs with up to 20,000 edges. Analyze paths, flows, centralities, clustering, and cliques. Import larger graphs for extended analysis. Export results and view statistical summaries.
Reference "Access and calculus tables with explanatory visuals. Pinch to zoom graphs and formulas. View detailed information with low power usage. Covers first-year topics."
Allows users to perform advanced mathematical calculations with variables, complex numbers, and matrices. Enter expressions using natural syntax for ranges, scientific notation, and matrix operations.
Tracks job costs with an itemised list of materials, labor, and service expenses. Generates invoices, estimates, and payment receipts. Monitors payments received and overdue amounts. Allows users to manage and view job-related financial details.
Create detailed property maps with irrigation, tree, and electrical system placements. Assign tasks to team members for project management. Collaborate on shared project plans and track progress in real time.