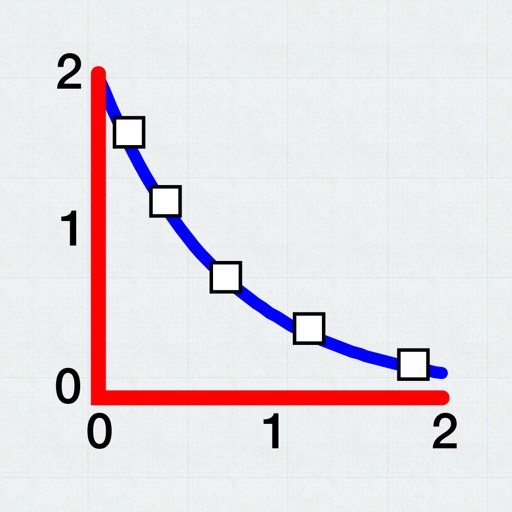
Allows users to plot and fit x, y data pairs. It supports curve fitting, value prediction, and kinetic data analysis. Data can be entered manually or imported from text or CSV files. Users can perform statistical analysis and generate graphs.
by Evan Kantrowitz★ 4.1106 ratingsProductivityFreeData updated 2026-09-08
The app builds interactive graphs of the Gompertz function and its derivatives. It fits curves to data, solves Gompertz function equations graphically, and calculates saturation and inflection points.
Practice with over 1510 questions and 151 revision notes covering Algebra, Geometry, Data Analysis, and Number & Operations. Take mock tests with mixed questions. Review detailed solutions and notes for each topic.
Collect and analyze data using sensors. Display results in real time with graphs or tables. Customize workspace with multiple plot areas. Use analysis tools like coordinates and curve fits. Export data for further study.
Teaches visual perception, hand-eye coordination, and problem-solving through interactive puzzles and . Includes mini- like dressing up a bunny, solving fruit puzzles, and identifying animal features.
Calculate minimum internal based on rate and maximum pressure loss. Input elevation changes and select valves and fittings. Display Reynolds number and friction factor. Export results in various formats.
Track across multiple platforms with real-time updates and low quantity alerts. View detailed reports and performance statistics. Set timed notifications for stock changes. Integrate with QuickBooks for purchase orders and invoices.
The app wirelessly collects data from up to 15 built-in science sensors for iPad. It allows for setup and data analysis of hands-on experiments in various science subjects, engaging students with interactive features.