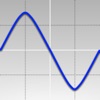
The app plots graphs of functions based on user-entered formulas and ranges. Users can input multiple functions separated by semicolons and view them simultaneously.
by Piet Jonas★ 1.02 ratingsEducation$0.99Data updated 2026-09-10
Create visual charts from numerical data with minimal input. Automatically generate graphs and adjust settings for clarity. Export charts in various formats and integrate with other applications for data analysis.
Solve complex math problems with step-by-step guidance. Access a library of formulas and equations. Create and save custom notes. Export solutions as PDF. Share calculations with others. Sync across devices.
Access for mathematics, physics, chemistry, and technology in one . Search and view equations with detailed explanations. Organize and bookmark key for quick reference. Share via email or social media.
Calculate concentration with molarity and dilution formulas. Input known values like moles, volume, or molarity to solve for the unknown. Perform dilution calculations and verify results instantly.
Access critical medical offline for emergency situations. Search and save favorite for quick reference. Stay updated with regular guideline revisions. Manage EMS workflows with integrated checklists and documentation tools.