The app allows users to chart data series by entering numbers separated by commas or spaces. It supports multiple data series, different chart types, and viewing data and graphs by rotating the phone.
by Piet Jonas★ 1.52 ratingsProductivity$0.99Data updated 2026-09-10
Create charts for project management and task tracking. Assign colors to tasks, set progress indicators, and link related tasks. Edit charts intuitively with quick access to customization options.
Track car mileage for a lease with a line chart showing projected usage. Input lease details and odometer readings to create a vehicle profile. Adjust driving habits to stay within mileage limits. View estimated mileage based on periodic updates.
View quotes and company news for listings. Track trends with interactive charts. Manage personal portfolios and synchronize with web finance data. Access updates and company details for Securities Exchange and National Exchange.
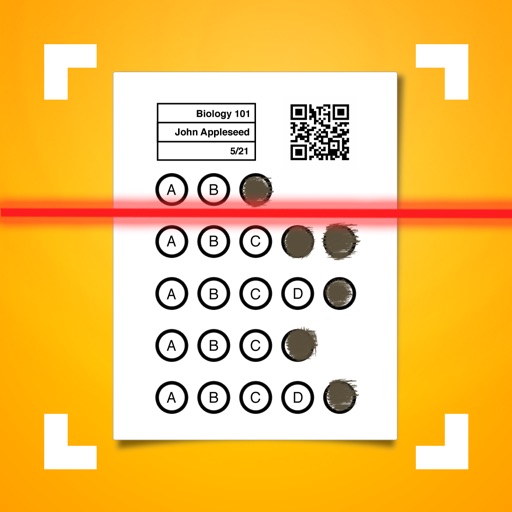
Allows users to create classes and configure assessment answers. It automatically grades bubble sheets and displays scores in real time. Export data to XLS or CSV, sync with Google Classroom, and integrate with .
Calibrate Intel RealSense D400 series depth cameras using a graphical chart displayed on a phone screen. The chart features black and white bars and blocks with fixed dimensions. Bars are 10 mm wide and heights are multiples of 10 mm.
View metrics for USD, EUR, JPY, GBP, AUD, CHF, CAD, and NZD. Compare relative performance across major forex pairs. Identify dominant currencies and track trends over time. Export charts and share insights directly.
Manage multiple sessions with data persistence. Switch between calculation histories. Apply color themes including Basic, Seashore, Art Deco, Cute, Redon, and Gitanes. Format numbers with global comma variations.
Generate CSV files with customizable string lengths and element levels. Create encoded data using numeric values. View character encoding tables. Export results in plain text format.
Access financial data via OAuth2 authentication. Manage net worth by currency. View historical asset account charts. Store access tokens securely using iOS Keychains. No external APIs or analytics tracking. Syncs with III instance.
Access free financial charts for stocks, crypto, ETFs, and FX. Create and analyze chart patterns to identify matching assets. Set up advanced watchlists. Receive alerts (coming soon). View real-time data and historical trends.
Analyze stock data using chart patterns, technical indicators, and oscillators. Search for stocks to receive buy, sell, or hold recommendations. View historical performance and compare with market trends. Set price alerts and track portfolio changes.
Access daily vibe checks based on your birth chart. Get real astrology insights and emotional support through private conversations. Explore love compatibility and track personal growth with a private journal.
Manage orders by buying, selling, amending, or canceling market and limit orders. Track stock prices and receive real-time alerts. Access trading tips and market updates. Monitor portfolio performance and set price alerts for specific stocks.