Solve Rubik's cubes by entering color positions, receiving 30-step solutions. Create custom patterns. Learn step-by-step through 3D animations matching real states. Track solving times with a timer for speed cubing.
Solve equations and perform algebraic manipulations. Graph functions and analyze data. Enter and analyze statistical models. Calculate derivatives and integrals. Export results and share solutions.
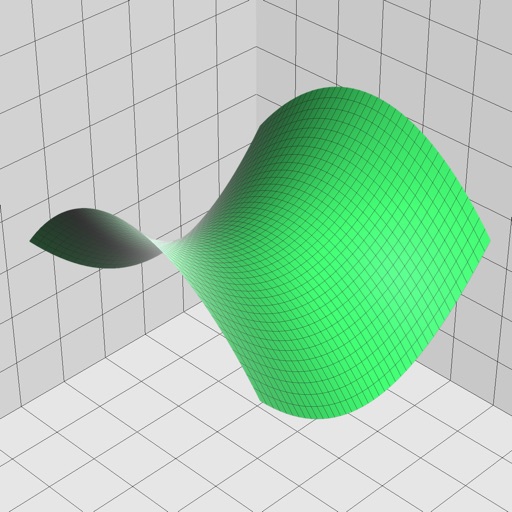
Enter and edit equations in mathematical notation. Visualize 2D and 3D graphs of explicit, implicit, and inequality equations. Adjust settings for display and analysis. Save and share calculations.
Convert currencies with live exchange rates for 180+ world currencies and 4 metals. View historic graphs up to 10 years. Convert multiple currencies at once. Search and add new currencies. Access Bitcoin rates. Use offline mode.
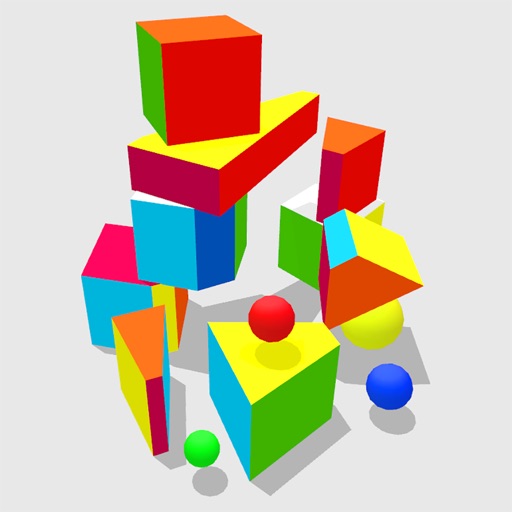
Explore 4D shapes through interactive play with a physics engine that simulates four-dimensional movement. Manipulate objects by poking, throwing, and rolling them. Observe how they behave in unseen dimensions.
The app solves quadratic equations, inequations, and functions. It offers a 3D rotating model of a parabola and a graph mixer for exploring function graphs.
Access , character analyses, and themes. Explore text and audio guides for popular and classic literature. Track reading progress and join discussion forums. Share insights and save notes within the .
Create and test mathematical algorithms with a powerful computational engine. Build interactive plots and animations. Execute code and view results in real-time. Share calculations and export data in multiple formats.
Allows users to solve puzzles with customizable themes. Features include shaking for hints, move-by-move validation, and adjustable difficulty levels. Users can track progress and learn new solving strategies.
Play a puzzle game by swiping to move tiles and merge same-colored tiles into one. Reach the WHITE tile to score points. Choose from 12 color themes, 3 board layouts, and unlock 22 achievements.
Scan problems from textbooks, screens, or handwritten notes. Get instant step-by-step solutions and explanations. Solve complex word and geometry problems. Access solutions anytime for continuous learning support.
The app collects, visualizes, and analyzes STEM learning data. It graphs live sensor data in real time and connects to wireless Bluetooth Smart sensors.
Calculates expressions as you type and stores answers for reuse. It includes four tabs with distinct colors. Users can multiply numbers, calculate tips, and find square roots without resetting. Graph 2D and 3D functions with a single touch.
Provides writing prompts and ideas for brainstorming. Includes of names, character traits, plot lines, occupations, obsessions, and action verbs. Supports multiple writing projects and formats. Allows users to generate and save custom .
Create, review, and revise written work with structured outlines and scene breakdowns. Organize scenes, characters, and dialogue. Export to various formats and sync across devices. Collaborate with others through shared projects.