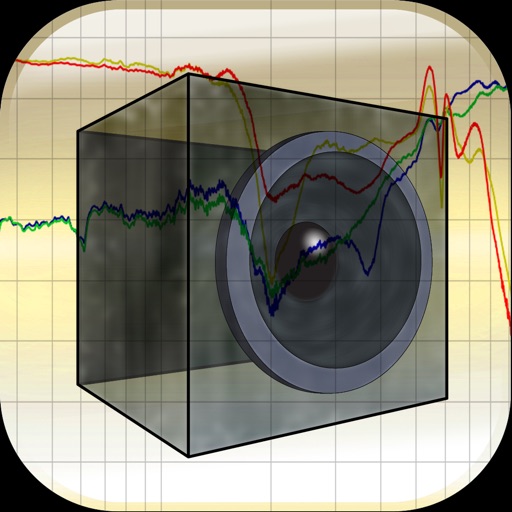
Analyzes audio using Fast Fourier Transform to display amplitude vs. frequency graphs. Displays detailed spectral analysis in octaves. Supports iOS microphone or external microphones for accurate measurements.
by Andrew Smith★ 4.06 ratingsMusic$10.99Data updated 2026-09-08
ToneBoosters displays real-time , spectrum, and goniometer visuals. It processes microphone input for audio analysis. Supports AUv3 plugin format for integration with compatible host apps.
The app trains reading notes on all 88 keys within various key signatures. It offers customizable practice options for different skill levels and tracks user progress with informative graphs.
Play music files from iTunes library and device storage. Adjust quality using the AQS-XI sound engine. Customize sound with equalizer, virtual surround, and cross fader.
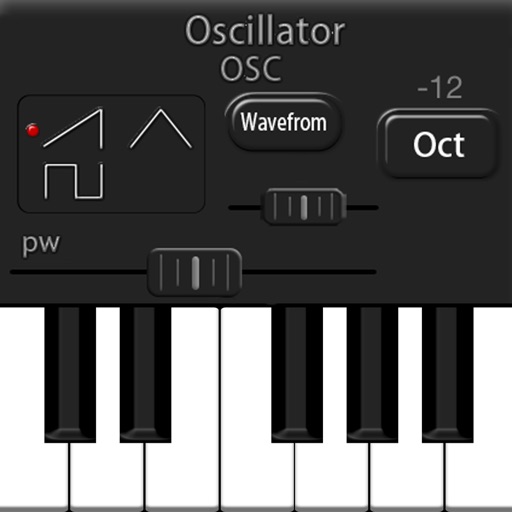
Allows users to create and manipulate monophonic sounds using phase distortion synthesis. It features two PD oscillators with waveform shaping options. Users can sequence with 8-step sequencers, sample and hold, and control modulation parameters.
Measures sound levels and logs data as a noise dosimeter. It functions as a spectrum analyzer, signal generator, and multi-channel recorder. Users can calibrate audio inputs and select input paths.
Decode Morse code audio into text using microphone or headset input. Automatically translate signals or manually adjust settings for weak signals. Control filter frequency, WPM speed, and background noise threshold.
The app analyzes singing or instrument pitch using the device microphone. It displays pitch on a scrolling graph, coloring notes green for on-pitch, red for sharp, and blue for flat.
View current speed with a scalable . Track total distance and trip data including max and average speed. Export trip data as GPX, CSV, or KML files. Receive alerts when speed exceeds or falls below set limits.
Record in WAV or M4A formats with mono or stereo settings. Choose microphone input for monoral or stereo recording. Adjust playback effects and save recordings for business or entertainment use.
Analyze analog devices with 7+ measurements including frequency response, distortion, and noise. Connect via USB. Export results as reports. Compare measurements against standards. Monitor real-time signals.
Allows users to graph mathematical equations in 2D, 3D, and 4D with animations. It supports vectors, matrices, trigonometric functions, and complex numbers. Users can plot cartesian, polar, and parametric equations.
The app supports data collection from various Vernier sensors and offers multiple data analysis features. Users can graph and analyze sensor data, perform calculations, and export results for reports.