Create charts with 10+ types including bar, line, and pie. Modify colors, labels, and data points. Export charts as PNG or SVG. Preview interactively with zoom and hover. Use modern material design interface.
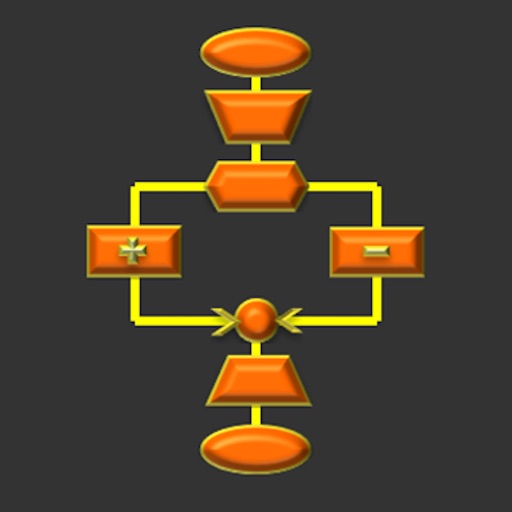
Visualize program execution and development understanding.
The app is a flowcharting programming environment that functions as an interpreter. It allows users to visualize program execution, aiding in software development comprehension through prebuilt demos and a tutorial.
Access the full text of the 18 chapters with Sanskrit, English, and Hindi translations. Read detailed commentaries and explore insights. Track progress with reading goals and reminders. Share verses with friends or save favorites for later.