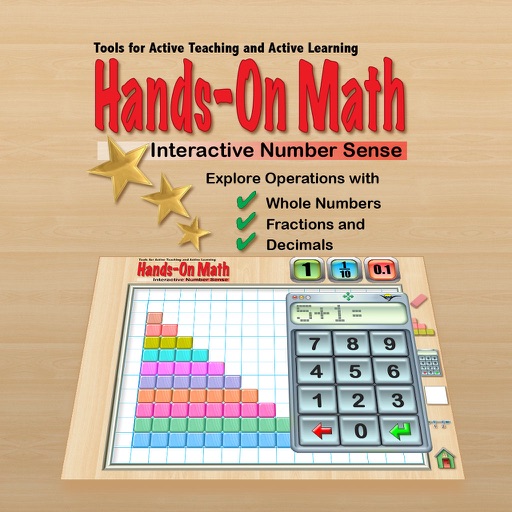
Explore , , and through visual representation. Paint grids and circles with colors to see how different proportions affect fractional, decimal, and percentage values. Adjust grid and circle sizes to observe changes in numerical representations.
Write and execute on mobile devices. Debug programs in real-time. Access a library of sample and tutorials. Save and share projects. Integrate with cloud storage for backups. Run legacy programs and explore retro programming features.
Reference "Access and calculus tables with explanatory visuals. Pinch to zoom graphs and formulas. View detailed information with low power usage. Covers first-year topics."