Graph functions in 3D Cartesian coordinates. Plot surfaces, lines, or dots with adjustable perspective, lighting, and rotation. Animate graphs along X, Y, or Z axes. Export tables of points sorted by X or Y values.
by Yuri Morozov★ 4.813 ratingsEducationFreeData updated 2026-09-06
Track rowing performance with real-time data from a Concept2 PM5 monitor. Log workouts, analyze stroke metrics, and export data to CSV for further analysis. Incorporate science and math concepts through rowing-related educational content.
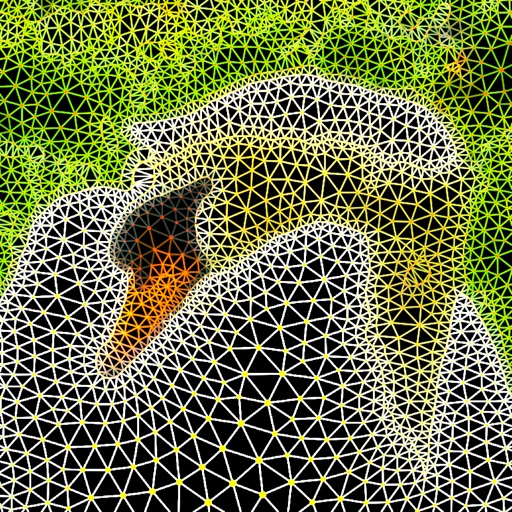
The app generates a triangular mesh from a photo and converts it to a vector image. Users can select from five mesh types and customize patch and node shapes and colors.