Create and customize standard celeration charts for behavior analysis. Input data points and generate graphs. Export charts and analyze trends. Customize display settings and apply advanced analytical methods. Sync data across devices.
by Xcelerate Innovations LLC★ 5.011 ratingsBusinessFreeData updated 2026-09-06
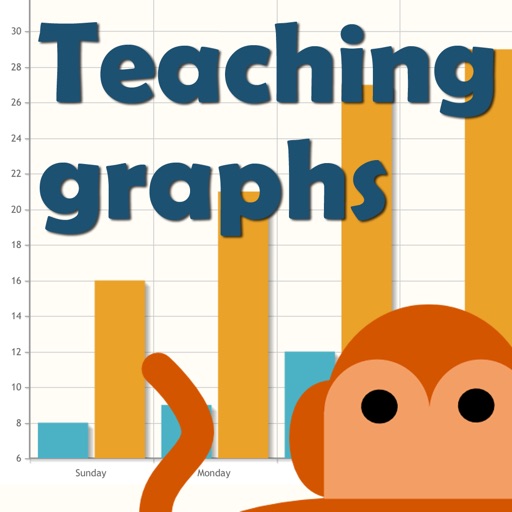
The app teaches basic graphs and data interpretation. It includes activities to read and make picture graphs, Venn and Carroll diagrams, bar, pie, and line charts.
The app calculates repeat lengths for diametric pitch and teeth number combinations. It reproduces values found on gear selector charts for DP geared presses.