Create and customize standard celeration charts for behavior analysis. Input data points and generate graphs. Export charts and analyze trends. Customize display settings and apply advanced analytical methods. Sync data across devices.
by Xcelerate Innovations LLC★ 5.011 ratingsBusinessFreeData updated 2026-09-06
Provide detailed sky maps for telescope and binocular users. Display 18 covering the equatorial region and polar areas. Show stars down to sixth magnitude, including double and variable stars. Include constellation boundaries and deep-sky objects.
Capture and digitize measurement charts using computer vision and image recognition. Export data in various formats. Integrate with accounting and reporting systems for energy industry use. Analyze and share measurement data for operational insights.
View real-time charts updated daily. Track currency exchange rates with automatic refresh. Submit suggestions directly through the . Customize settings to fit business needs. Compatible with iPhone and iPad.
Allows users to calculate compressor processes, including overall and stage compression ratios. It includes 19 calculators and data charts for design, operation, fabrication, and maintenance of diaphragm compressors.
Track attendance and homework using a customizable seating chart. Log behaviors like "Talkative" or "Helpful" directly on the chart. Randomly select students for participation and create groups for activities.
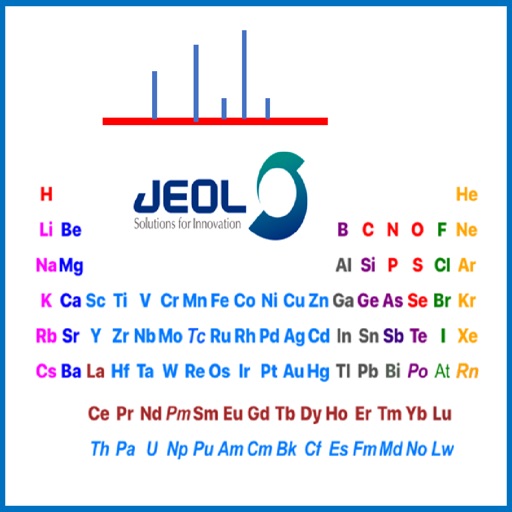
Reference allows users to select between mass spectrometry, energy-dispersive x-ray spectroscopy, or nuclear magnetic resonance spectroscopy tables. Clicking on elements shows method-specific information about stable isotopes.
The app offers a pocket vision screener with randomized Snellen and Tumbling E charts. It can provide a rough vision screen when a chart is not available or complement static charts.