Calculate probabilities based on input event counts and total experiments. Display statistical results and graphs. Export data in various formats. Share findings via email or messaging.
A letter for visual acuity testing. Display optotypes like Sloan, Landolt C, and pictorial charts. Support multiple visual acuity formats including metric and imperial. Connect via AirPlay to TV or computer.
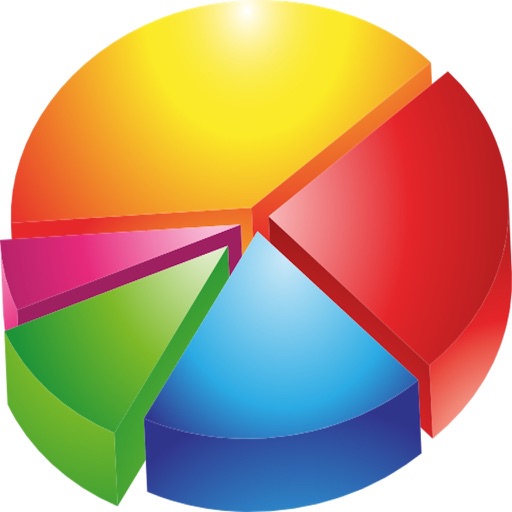
Create charts with 10+ types including bar, line, and pie. Modify colors, labels, and data points. Export charts as PNG or SVG. Preview interactively with zoom and hover. Use modern material design interface.
Simplify expressions and Maps. Input logical expressions or maps. Perform minimization and view simplified results. Support multiple algebra formats. Export solutions and save work.