Monitor system performance by checking CPU usage, memory consumption, and battery levels. View detailed graphs and logs. Clear cache and manage background processes. Set performance alerts and optimize storage.
by Business Applications Performance Corporation★ 5.07 ratingsUtilitiesFreeData updated 2026-09-25
Calculate hydraulic and electrical needs for irrigation systems. Input system flow rate and application rate. Determine pivot pad specifications. Assess pressure and electrical requirements. Generate detailed reports for system .
Monitor and control Jablotron alarm systems remotely. View system status and device logs. Arm or disarm systems. Receive alerts and manage user permissions. Check activity history and track device locations.
Monitor key performance indicators in real time. View customizable dashboards. Set alerts for threshold changes. Export data reports. Integrate with industrial systems for asset performance tracking.
Track vehicle movements with real-time data including location, speed, and fuel consumption. Receive alerts for geo-zone entries, speeding, theft, and emergencies.
Track pitch performance with detailed charts and advanced filters. Log throws, monitor velocity and movement. Sync data across devices and share live updates with teams and players.
View live and recorded video from multiple locations through a centralized platform. Store encrypted video footage in the cloud for up to one year. Use AI to detect anomalies and identify objects in real time. Set up alerts for specific events.
Track shooting performance with session logs, scorecards, and bullet counts. Record rounds, analyze accuracy, and export data. Sync with firearms accessories for real-time feedback. Set practice goals and monitor progress over time.
Receive notifications about support case status, cloud system updates, and SAP community activity. Create and manage support cases. View open service requests. Monitor SAP cloud system performance.
Control and monitor Acoustic Devices remotely. Adjust volume, set pre-programmed sequences, and manage device settings. View usage statistics and receive system alerts. Connect via wired input or Bluetooth.
Monitor aircraft, prevent collisions, manage space
Monitor aircraft hangar operations in real time with sensor data. Track collisions and receive alerts. Analyze space usage and optimize layout. Manage equipment and schedule maintenance remotely.
Manage and visualize building objects like switches, sensors, and actuators remotely. Monitor real-time video feeds. Control devices and view system status from anywhere. Sync with FVS system for device management.
Track harvesting equipment like feller bunchers and skidders in real-time. Monitor performance and productivity metrics. Receive boundary warning alerts to prevent trespassing. View equipment locations and operational data on a map.
Track and monitor vehicle locations in real time. Receive alerts for speed, geofence violations, and engine status. Generate detailed reports on fuel usage, routes, and driver behavior.
Update firmware to access new features and improved performance. Enable enhanced responsiveness and additional functionality. Optimize typing experience and ensure device compatibility.
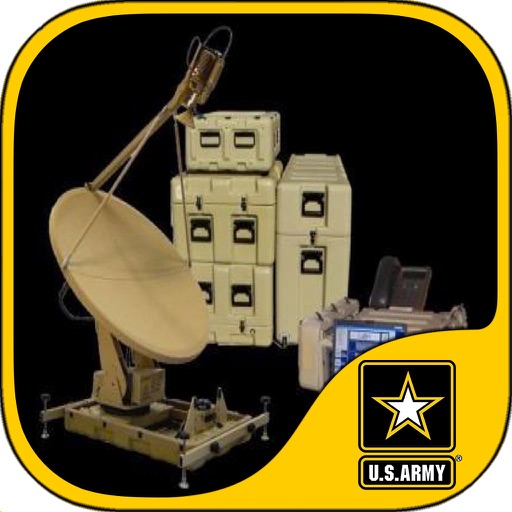
Optimize Army sustainment communications system interface.
The app provides users of Army sustainment systems with information to optimize their interface with the communications system. It ensures users have the technical and functional information needed for Army automated sustainment information systems.
Track energy production from your On Grid system. View real-time and historical data. Set alerts for energy usage and generation. Export reports and monitor system performance remotely.
Track performance metrics and set professional goals for career development. Monitor income progress and exclusive resources for stylists. Sync with Zenoti account for real-time updates and data management.
Monitor battery status with real-time voltage, current, power, and internal resistance readings displayed as gauges and numerical values. Track battery data using timeline charts.