Collect and analyze data from up to six sensors at once. Perform statistical analysis on full or selected datasets. Choose from ten curve fitting functions to plot and display formulas. Show error bars based on sensor specs or trial statistics.
Create structured learning pathways by curating mixed-media resources and notes. Organize content for personal or shared use. Track progress and access materials across devices. Export notes and share learning paths with others.
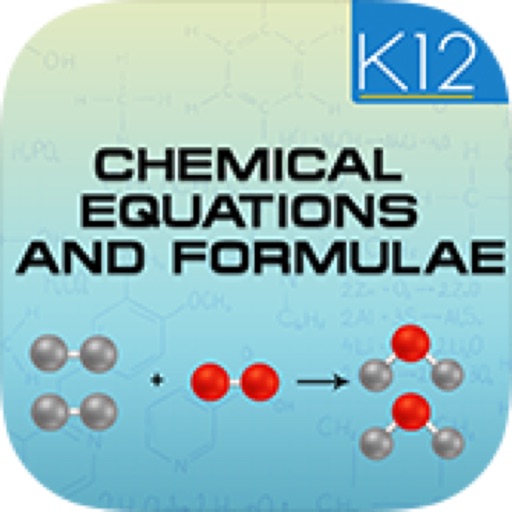
Balance chemical equations instantly with automated calculations. View step-by-step solutions and explanations. Use a clear, intuitive interface for visual learning. Input equations directly for immediate results.