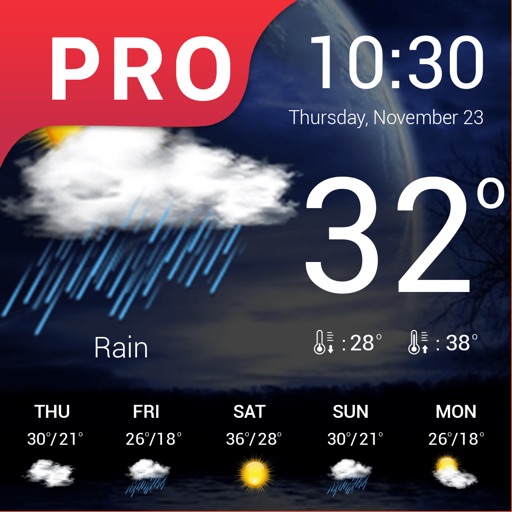
Track patterns and impacts with real-time updates. Monitor pollen, air quality, and humidity levels. Receive alerts for changes affecting . Log symptoms and analyze correlations with data. Predict indexes and provide early warnings.
Report precipitation types and locations in real time. Submit observations via photo or text. View maps showing reported weather data. Receive notifications about severe weather events. Track personal observation history.
View real-time images and current conditions. Tap to zoom and pan across maps. Receive alerts for severe . Share images via social media or email. Sync with location for automatic updates.
View real-time data with 250-meter resolution for the continental U.S. Access raw Nexrad Level 3 station data for detailed products. Switch between mosaic views and individual types like reflectivity, velocity, and polarization.
The app displays skew-t log-p charts with temperature, dew point, and winds aloft. It shows current radar, Airmets, Sigmets, and SkewT data filtered by altitude.
The app provides daily volcanic activity news from the United States Geological Survey and GeoNet. It includes alert levels, aviation color codes, and detailed information on active volcanoes.
The app displays a satellite map of dropzones. It shows current windaloft and surface winds, a range of the user's parachute, and a safe jump run exit area.
View 15-day and hourly forecasts. Check current conditions and locate nearby stations. Access astronomical data including moon phases, sunrise, and sunset times. Use a moon phases calendar for both hemispheres from 1900 to 2199.