Calculate discounts by entering an amount and adjusting the slider or inputting a . Display new and discount amounts rounded to two decimal places. Switch tabs to compare percentages of values relative to each other.
Solve equations using two points, one point and slope, or coordinate values. Input decimals and fractions. View step-by-step solutions and plot graphs. Store calculation history and share final results.
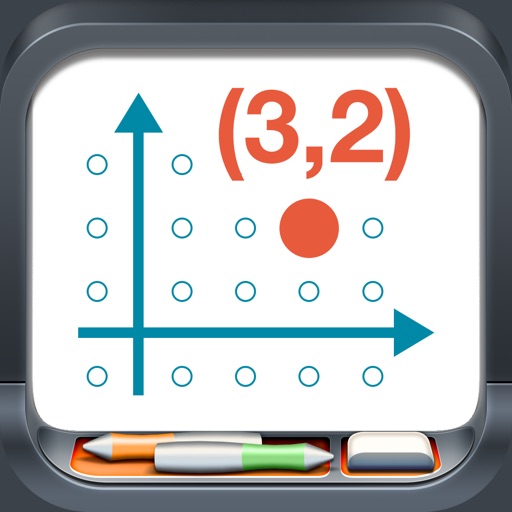
Model points and lines on a plane with colored elements and pair labels. Use a 19x15 grid or dot/square grid. Display tables of values and sliding axes. Graph ordered pairs, distance, and transformations. Plot ratios, rates, and linear equations.