Explore animated datasets like Saturn’s rings, atmospheric storms, and climate change. Rotate and zoom 3D models. Compare data layers. Save and share visualizations. Learn about environmental processes through interactive imagery.
by University of Colorado Boulder★ 4.720 ratingsEducationFreeData updated 2026-09-14
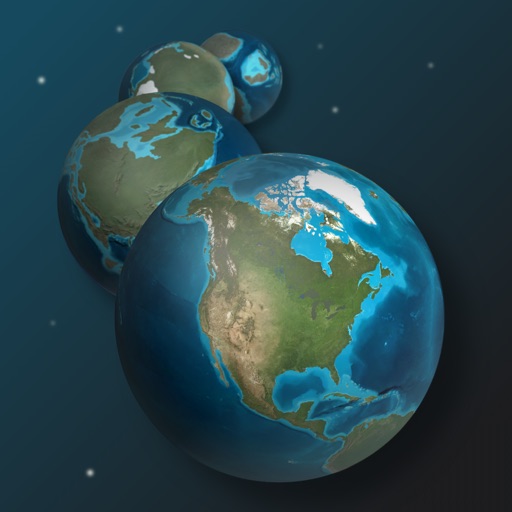
Explore Earth's dynamic history through interactive timelines and geological data. View tectonic plate movements over time. Analyze climate changes and asteroid impacts. Compare different geological eras and their characteristics.
Track real-time conditions for coastal and water-based activities. View wave heights, wind speeds, and tide schedules. Receive alerts for storms and hazardous . Share current conditions with others.
Access real-time ocean data including wave heights, wind speed, water temperature, and currents from over 750 buoys. View detailed forecasts and conditions for sailing, surfing, and fishing.
Learn geography by identifying countries, capitals, flags, emblems, currencies, and cities. Play quizzes in flag mode, capital mode, and elimination mode. Test knowledge and track progress through interactive challenges.
Explore Earth's geological history by visualizing continents, oceans, and climate changes over billions of years. Adjust time scales to view past landscapes, track sea level shifts, and observe planetary transformations.
Explore a 3D model of the International Space Station. Rotate, zoom, and select individual components for detailed views. Access information tabs for part descriptions, hierarchy, settings, and details. View the entire ISS with labeled categories.
Monitor severe with real-time and storm signatures including vortex, hail storm, and damaging wind indicators. Access reports on tornadoes, severe hail, and damaging winds.
The app allows users to explore an ocean environment with swipe gestures to change the viewpoint. An auto camera focuses on points of interest for relaxation.