The app tracks the carbon intensity of the GB electricity grid. It displays instantaneous carbon intensity and provides a traffic light indicator for low and high periods.
Monitor visual acuity, near vision, macular function, and color vision with built-in eye charts, near reading charts, Amsler grids, and color testing plates. Test astigmatism and track changes over time.
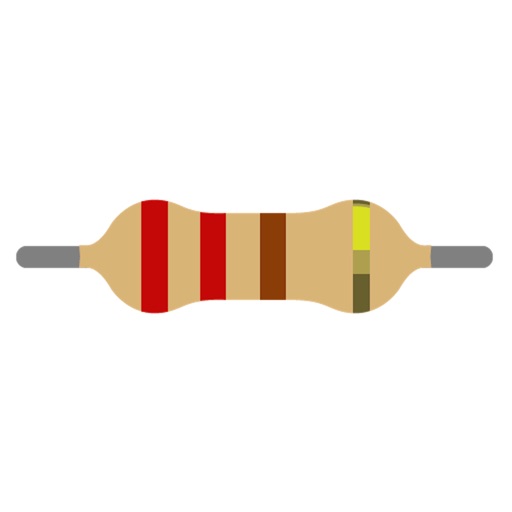
Calculator determines resistance value based on colored bands. Users select band count and for each band. The displays the resistance value and visual representation of selected colors. Helps configure electronics projects.