Measure horizontal and vertical angles with precision. Set reference points and receive haptic feedback for alignment. Mark reference points and adjust settings for accurate measurements.
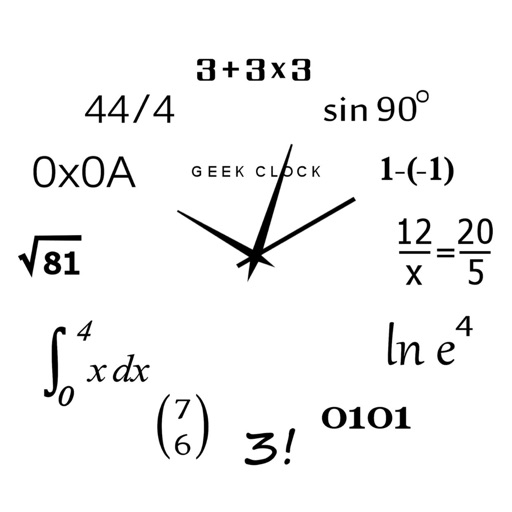
Display time using math problems instead of numerals. Switch between horizontal and vertical layouts. Toggle day and night themes. View animated quotes related to culture. Solve equations to reveal time.
Displays device details including disk capacity, network IP addresses, cellular carrier data, CPU usage, and RAM statistics. Users can view hardware specifications, storage usage, and performance metrics.
Customize keyboard layouts with user-defined keys for letters, Greek symbols, math operators, arrows, and emojis. Organize keys into stack-based panes and switch between them automatically or manually.
Monitor CPU performance by viewing current and maximum frequencies. Track battery health with real-time data. Receive notifications when device firmware changes. Check device specifications and system status.
Manage containers, view logs, and monitor performance
Manage environments with a visual dashboard that centralizes performance metrics, container logs, and actions across multiple servers. Monitor containers, networks, and volumes. Address issues quickly with intuitive interface and centralized control.
Trim videos to 2–15 seconds. Cut segments and split into two parts. Rotate, crop horizontal to vertical, and take screenshots. Update dates to appear at the top of the gallery.